
3.6. Probes
The list of project-related probes is displayed on this page. Here, user can manage probes and add new ones.
A probe is a software component of Boro VoD that performs media file validation tasks against a test template. Each probe is linked to a specific project and operates in accordance with the project-related configuration and templates. For scaling purposes, an unlimited amount of probes can be launched as part of a single project.
Located in the top right corner is the  button—click to download a ZIP archive.
The archive contains Linux- and Windows-compatible probes.
button—click to download a ZIP archive.
The archive contains Linux- and Windows-compatible probes.
Note
User provides their own hardware for the probe. Technical support team tsup@elecard.com can help pick the optimal platform for your needs. See the System Requirements for minimum system requirements.
After creating a project, you can download the probe from your profile. Note that the probe folder contains the project key. This means that the probe gets automatically linked to a certain project. A launched probe will be accessible only by the project that it was downloaded from.
Multiple copies of one probe can’t be launched at the same time. Apart from the unique key, each probe additionally has a unique ID. The system will not allow you to launch two copies of one probe! To do that, download the archive again and unpack it in a different folder or on different hardware.
A probe doesn’t upload media files in any shape to the Boro VoD server. All analysis is performed locally—on the hardware that the probe was launched on. Only statistical data (bitrate volume, audio loudness levels, tracked errors) and video track thumbnails are uploaded to the Boro VoD server.
3.6.1. Start and Stop
Launching the Probe
Linux
Copy the downloaded probe archive to the desired folder.
If needed, install the
unzippacket. Installation commands for:Rocky Linux 8, AlmaLinux 8, RHEL 8:¶sudo dnf install unzip
Ubuntu 24, Debian 10:¶sudo apt install unzip
Access the probe archive folder and unpack the archive, here’s an example of how you unpack and create a directory:
sudo mkdir -p /opt/elecard/boro_vod && sudo unzip ./BoroVoD.1.0.1.2026.03.25.projN.zip -d /opt/elecard/boro_vod/
Go to
cd /opt/elecard/boro_vod/lin64/In the
monitor.cfgfile:edit the
AppDescriptionfield (specify the probe’s name that will be displayed in the system). Do not use the following characters:",<>;if needed, uncomment the
proxyfield by deleting the//characters at the start of the string.
Launch the probe from the terminal:
sudo ./ProbeVoD.In case of a successful launch, the probe will appear in the Active probes list. From now on, all further operations (launching, configuring, and stopping tasks) are done via the browser.
If the probe failed to launch, see the Troubleshooting part.
Windows
Copy the downloaded probe archive to the desired folder.
Access the probe archive folder and unpack the archive.
Go to
win64In the
monitor.cfgfile:edit the
AppDescriptionfield (specify the probe’s name that will be displayed in the system). Do not use the following characters:",<>;if needed, uncomment the
proxyfield by deleting the//characters at the start of the string.
Launch the probe with administrator privileges (right-click on
ProbeVoD.exe➝Run as administrator). Next, the command prompt should pop up.In case of a successful launch, the probe will appear in the Active probes list. From now on, all further operations (launching, configuring, and stopping tasks) are done via the browser.
If the probe failed to launch, see the Troubleshooting part.
Attention
the proxy server specified in environment variables will not be used by the probe. To use a proxy server, specify it explicitly in the
monitor.cfgfile.
To check the list of active probes, see the Active probes block.
Launching the Probe as a Service
Linux
The following steps apply to: Rocky Linux 8, RHEL 8, Ubuntu 20, Debian 11 and later versions of these systems.
Go to the directory with the unpacked probe, then the
/share/service-daemon/subdirectory. Open theboro_vod-client.servicefile in a text editor and specify the the path to the probe (ProbeVoD) via theWorkingDirectoryfield, and the path to the executable via theExecStartfield.Save the file and copy it to
/etc/systemd/system/.Run the following command to make sure the service launches:
sudo systemctl start boro_vod-client
To enable auto launch, run the following command:
sudo systemctl enable boro_vod-client
Check the status of launched service:
sudo systemctl -l status boro_vod-client
The highlighted strings show that the auto launch for the service is
enabledand that it is currentlyactive (running).
Windows
Installation with script
You can install and run the service automatically with script. Scripts to work with the probe are located in the folder
share/service-daemonof the probe archive. Before the installation, copy BoroVoD_ServiceInstall.bat and BoroVoD_ServiceUninstall.bat scripts to the probe’s folder/win64. The BoroVoD_ServiceInstall.bat file successively performs the following actions:Registers the service with the
Boro_VoD_servicename;Creates rules for the firewall to allow inbound and outbound traffic for ProbeVOD.exe in any network;
Starts the registered service.
The BoroVoD_ServiceUninstall.bat file deletes created rules for the firewall, stops and deletes the registered service. To install or delete a service, execute the corresponding script with administrator privileges.
Manual installation
Run the command prompt as an administrator and access the
/win64folder with the unpacked archive.Enter the service’s name without blank spaces (for example,
Boro_VoD_service) and run the probe launch command with the-Roption:ProbeVOD.exe -RBoro_VoD_serviceNote
If you receive the error
OpenSCManager failed error 0x00000005in response, it indicates that the command prompt does not have the necessary administrative privileges.Press the
Win+Rcombination (or right-click the Start button, then click on Run). In the window that popped up, enterservices.mscthen click OK or press Enter. This will cause theservices.mscwindow to open—findBoro_VoD_servicethere and launch it.In case of a successful probe-server connection, you will see the Running status in the Properties window.
Note
By default, the service is installed with auto launch to be initiated along with the OS’ start-up. You can change the launch type in the Properties window.
To install the second service, download another probe and repeat the above-mentioned steps. Make sure that each service has its own unique name!
Stopping the Probe
A probe can be stopped via the one of the following ways:
Press the
Ctrl+Ccombination in the terminal once, then wait for the probe to stop correctly (this can take up to 1 minute). This applies to both Linux- and Windows-based systems. If you simply close the terminal, probe will not forward the stopping command to the server, leading to incorrect probe termination. The server will be waiting for a response from the incorrectly stopped probe for 1 minute, and only then will it transfer tasks to the TBD Incomplete tasks block withCanceledresult;Use the
 button, available both in the Active probes list and on a specific probe’s page (click for more).
Click and confirm action in the pop-up window.
button, available both in the Active probes list and on a specific probe’s page (click for more).
Click and confirm action in the pop-up window.Warning
Once a probe is stopped, it cannot be launched via the web interface!
To check the list of stopped probes, see the Inactive probes block.
Stopping the Probe as a Service
Linux
The following steps apply to: Rocky Linux 8, RHEL 8, Ubuntu 20, Debian 11 and later versions of these systems.
To stop a service, run the following command:
sudo systemctl stop boro_vod-client
To disable auto launch, run:
sudo systemctl disable boro_vod-client
Note
After restarting Linux, the service will be relaunched if the auto launch is still enabled.
Check the status of launched service:
sudo systemctl -l status boro_vod-client
The highlighted strings show that the auto launch for the service is (disabled), and the application is inactive (dead).
Windows
To stop a probe service, press the
Win+Rcombination (or right-click the Start button, then click on Run). In the window that popped up, enterservices.mscthen click OK or press Enter. This will cause theservices.mscwindow to open. FindmyBoroVoDServicethere, open its properties and click on Stop. This will change the status to Stopped.To delete a service, run the command prompt as the administrator, access the
/win64folder with the active probe, and run the probe launch command with the-Uoption:ProbeVOD.exe -UmyBoroVoDService
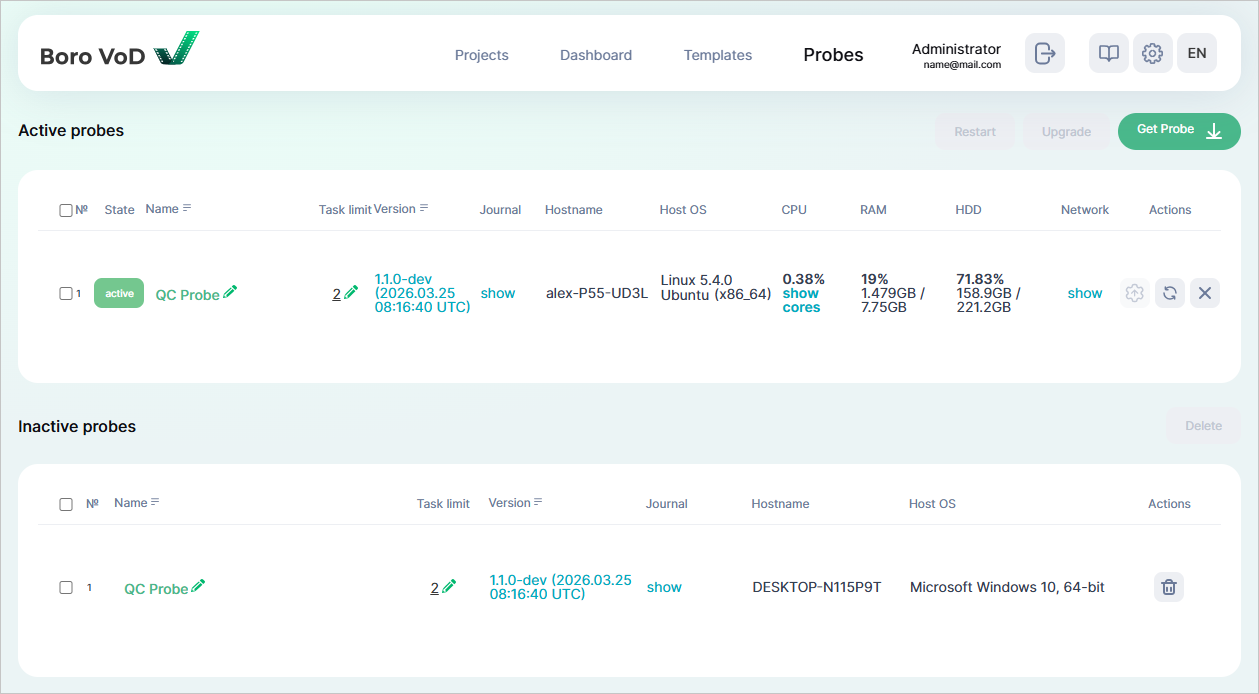
3.6.2. Active Probes
This block displays a table that active probes are automatically added to. The table’s columns include:
№ — probe’s numerical order in the table;
State — state of probe. A launched probe will have the
activestate;Name — name of probe. Click to be redirected to the probe’s page. To change the probe’s name, click on
 ;
;Task limit — max number of simultaneously performed media file validation tasks. To change the limit, click on
and specify the value.
Changes will apply instantly;Version — version of probe. Click to open the window with probe update history;
Journal — journal of probe-related events, contains the history of probe launches, updates, and terminations. To view the journal, click on show;
Hostname — information regarding the name of the computer that the probe is launched on;
Host OS — information regarding the operating system that the probe is launched on;
CPU — statistics of CPU usage. Lets the user take measures to ensure good performance for systems that probes are launched on in a timely manner. To view statistics on CPU usage, click on show cores;
RAM — statistics of RAM usage;
HDD — statistics of HDD fullness;
Network — statistics of network interface usage. To view statistics, click on show;
Actions — tools for managing a certain probe:
 — click to open the window containing a list of official probe’s versions available for upgrade.
Choose the version you’d like to upgrade to and confirm the action,
— click to open the window containing a list of official probe’s versions available for upgrade.
Choose the version you’d like to upgrade to and confirm the action, — click to open the window for probe restart confirmation,
- — click to open the window for probe stop confirmation.
Warning
Once a probe is stopped, it cannot be launched via the web interface!
To restart multiple probes at the same time, tick the checkboxes of the needed probes in the list and click on  in the top right corner.
This will cause a confirmation window to pop up.
in the top right corner.
This will cause a confirmation window to pop up.
To upgrade multiple probes at the same time, tick the checkboxes of the needed probes in the list and click on in the top right corner, then confirm the action in the window that popped up.
3.6.3. Inactive Probes
After a probe is stopped, it will end up in the Inactive probes block. Regarding a certain inactive probe, you can view its name, task limit, version, hostname, and host OS that it was launched on. Probe launch and event history are available in the probe journal.
To exclude an inactive probe from the list, select a probe, click  and confirm the action.
3.6.4. Upgrading the Probe
Remote upgrade via the web interface
Go to Probes → Active probes, find the bar with the required probe and click
.
Click to open the window containing the list of versions available for upgrade.
Choose the version you’d like to upgrade to and confirm the action;To upgrade multiple probes at the same time, select the required probes in the Active probes block and click on the
 button in the top right corner, then in the opened window select the version and confirm deletion;
Go to the probe’s page then click on
.
Clicking will open the window containing the list of versions available for upgrade.
Choose the version you’d like to upgrade to and confirm the action.
Via the command prompt
If the probe is launched, stop it by pressing
Ctrl+Cwhen in the command prompt. If the probe is launched as a service, refer to the Stopping the Probe as a Service section.While in the terminal, access the directory that a probe is located in, then launch it with the
-uparameter:Linux:¶./ProbeVoD -uWindows:¶ProbeVoD.exe -uIf the server has an available upgrade, the probe will upgrade the required components and then display the version that it upgraded to. If there is no available upgrade, the console will return the message
No updates!To check the current probe version, use the
-vkey:elecard@localhost:/opt/elecard/boro_vod/lin64# ./ProbeVoD -v date changed[parent,pid:280753]: 03.09.2025 Version: 1.1.0 Build info: 2025.08.05 06:07:13 UTC Platform: lin64
3.6.5. Probe Page
Displayed at the top of the page is the probe-specific information block that includes:
Description — name of probe. Click on
to rename;Version — version of probe. Click to open the window containing the probe upgrade history;
Host OS — information regarding the operating system that the probe is launched on;
Status — status of probe. Launched probe will have the
activestatus. Located nearby are the following buttons:- — click to open the window for confirming probe restart;
- — click to open the window for confirming probe stop,
Warning
Once a probe is stopped, it cannot be launched via the web interface!
- — click to open the window containing a list of official probe versions available for upgrade.
Choose the version you’d like to upgrade to and confirm the action.
Hostname — information regarding the computer that the probe is launched on;
Probe profile — by default, the
defaultvalue is specified;CPU — statistics of CPU usage. Lets the user take measures to ensure good performance for systems that probes are launched on in a timely manner. To view statistics on CPU usage, click on show cores;
RAM — statistics of RAM usage;
HDD — statistics of HDD fullness;
Note
In case of high load on CPU and RAM, warning indicators will be displayed. Indicator color changes depending on how loaded RAM and CPU are and in reliance to configured threshold values and color settings.If the threshold is exceeded, the orange-colored CPU/RAM warning is displayed. By default, the threshold value is70%.If the threshold is exceeded significantly, the red-colored CPU/RAM warning is displayed. By default, the threshold value is90%.Probe events journal — contains probe launch, upgrade, and stop history. To view the journal, click show. If needed, filter out the journal records by setting the System events or User actions checkboxes;
Network interfaces — statistics on network interface usage. To view the statistics, click show;
Task resources — click on show to view resource consumption by probe tasks. In the pop-up window, you will see task-related CPU, RAM, and PID.
3.6.6. Troubleshooting
Probe Doesn’t Launch
See below for possible reasons why the probe failed to launch:
Failed to connect with the server. To launch a probe, there needs to be a stable connection with the server part, for the analyzer to be able to sign up on the server. Do the following steps:
Linux
Use the
pingcommand to check if the Boro VoD server is available. This command will send 4 test packets to the specified server. Ensure that your computer received the responses and that no packets were lost:ping -c 4 <Boro VoD server IP address or domain>
check the routing table. It could be that your hardware has multiple network interfaces and the routing table was configured incorrectly.
sudo ip r
Trace the route that the packets go through on their way to the server. It could be that your hardware has multiple network interfaces and the routing table was configured incorrectly. The
traceroutecommand can show the intermediate waypoints and help identify where the routing breaks:sudo traceroute <Boro VoD server IP address or domain>
Incorrectly configured time on the device with a probe on board can lead to issues establishing an HTTPS connection with the Boro VoD server. Make sure that the system date and time are correct using the
datecommand.Example of error in case of incorrect date and time¶check_crt_verify_thread:: can't verify_certificate: err = x509: certificate has expired or is not yet valid: current time 2025-08-08T09:52:35+05:00 is after 2025-02-22T17:00:00Z
Windows
Use the
pingcommand to check if the Boro VoD server is available. This command will send 4 test packets to the specified server. Ensure that your computer received the responses and that no packets were lost:ping <Boro VoD server IP address or domain>
Trace the route that the packets go through on their way to the server. It could be that your hardware has multiple network interfaces and the routing table was configured incorrectly. The
traceroutecommand can show the intermediate waypoints and help identify where the routing breaks:tracert <Boro VoD server IP address or domain>
Incorrectly configured time on the device with a probe on board can lead to issues establishing an HTTPS connection with the Boro VoD server. Make sure that the system date and time are correct using the
echo %date% %time%command.Example of error in case of incorrect date and time¶check_crt_verify_thread:: can't verify_certificate: err = x509: certificate has expired or is not yet valid: current time 2025-08-08T09:52:35+05:00 is after 2025-02-22T17:00:00Z
Wrong server address and/or port specified in the
monitor.cfgfile →serverfield;Unstable connection with the server (try to restart);
Proxy server is used to establish the connection with the Boro VoD server, but:
proxy server is specified in environment variables. To use a proxy server, specify it explicitly in the
monitor.cfgfile,proxy server isn’t specified (or specified incorrectly) in the
monitor.cfgfile, or the string is commented.
Firewall restrict’s the application from accessing the local or global network. In Windows, enable the use of private and public networks for
ProbeVoD.exe(tick two checkboxes in the Windows Firewall);Changes in the
monitor.cfggo against the JSON format, or the newly added data go against the<ConfigFile>data structure that’s specified in themonitor.cfgfile. Additionally,monitor.cfghas to be saved in UTF-8 format. In case there are issues regarding the configuration file, usually the start-up parse errors end up in the command prompt’s log. In this case, redownload the archive from your profile and put a fresh, unchangedmonitor.cfgfile in the folder that you tried to launch a probe from. Be sure to set the probe’s name again and, if needed, specify the proxy server;It could be that certain libraries were deleted or corrupted within the application’s folder. Redownload the archive and in the fresh package, replace the
monitor.cfgиauthkey.pubfiles with the ones of your own. Better copypaste the hidden.stored.cachefile too—this way another record with the same probe name will not be created;You might be trying to launch a heavily outdated version of probe. Download a fresh probe package from your profile, configure the
monitor.cfgfile, and try to launch the probe again;Your Linux distribution is outdated. Support for
glibc-2.27and later (Ubuntu 20.04, Debian 11, Rocky Linux 8, AlmaLinux 8, RHEL 8 and later) is required.