
3.4. Task Page
Task page contains full information regarding a specific media file validation task. The page includes the information block with task configuration, test results diagram, infographics (bitrate, audio track loudness, video track thumbnails), and journal.
You can navigate to the task page from the Dashboard. To do this, click on o a task’s name or URI in the Running Tasks, Completed Tasks, or Incomplete Tasks blocks—or on the result in the Completed Tasks and Incomplete Tasks blocks.
3.4.1. Information Block
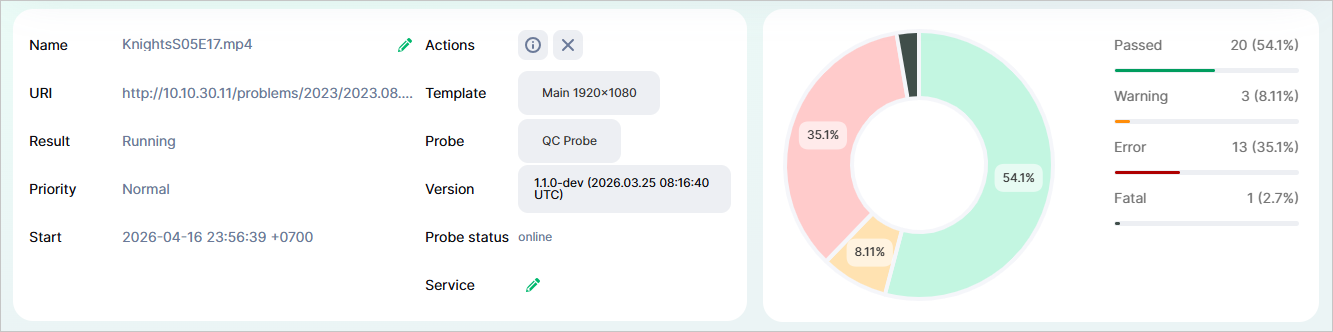
Task Name;
URI (location of the media file being validated);
Result (Status);
Priority;
Start and end date and time of validation task (YYYY-MM-DD hh:mm:ss);
Template;
Probe and its version;
Probe Status;
Service Name;
Buttons:
 — when clicked, the task will be canceled and placed in the Incomplete Tasks block with its result set as
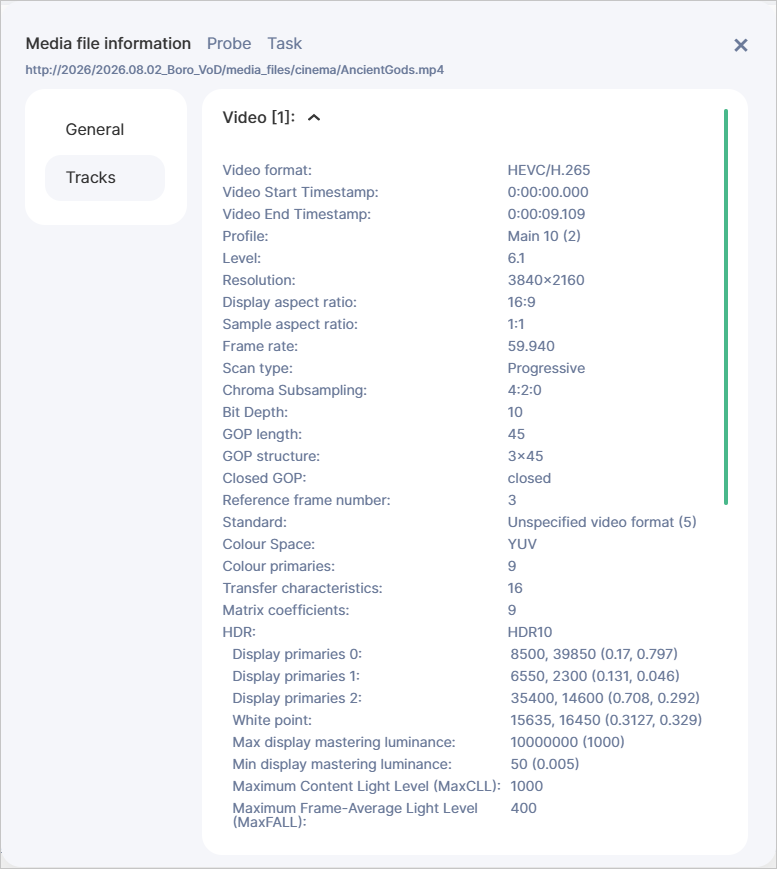
 Canceled. The button is available while the task has aRunningstatus, — when clicked, a window will open with the main parameters of the media file: video, audio, and container.
The diagram shows the distribution of test-related records from the journal in %.
3.4.2. PID Bitrates
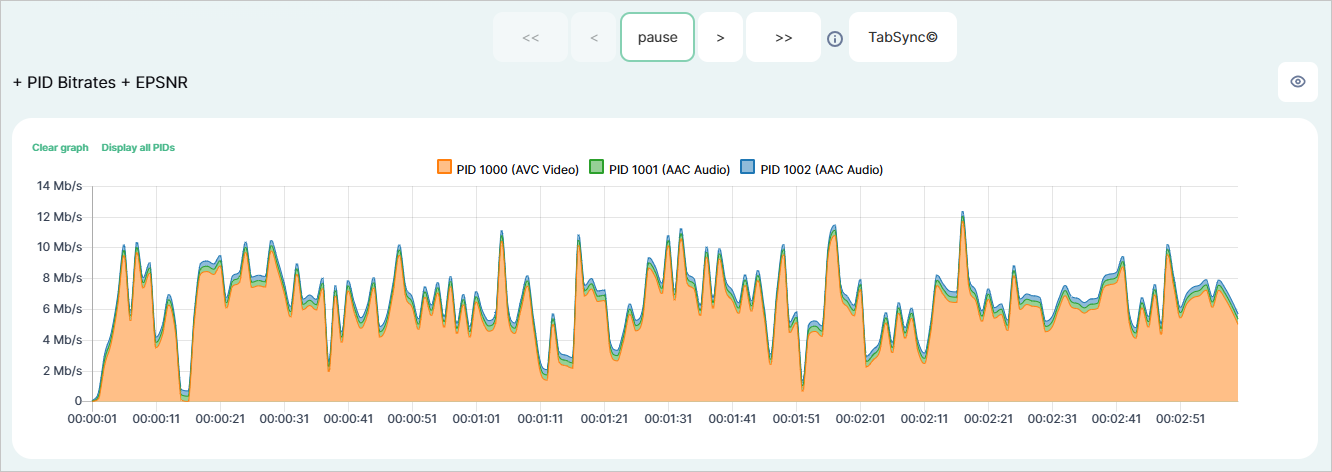
Note
On the task page, all graphs are displayed as three-minute intervals. The following navigation buttons are available for moving through the graphs:
+1m/−1m— to move forward or backward by one minute;+3m/−3m— to move forward or backward by three minutes at a time.
3.4.3. Audio Loudness
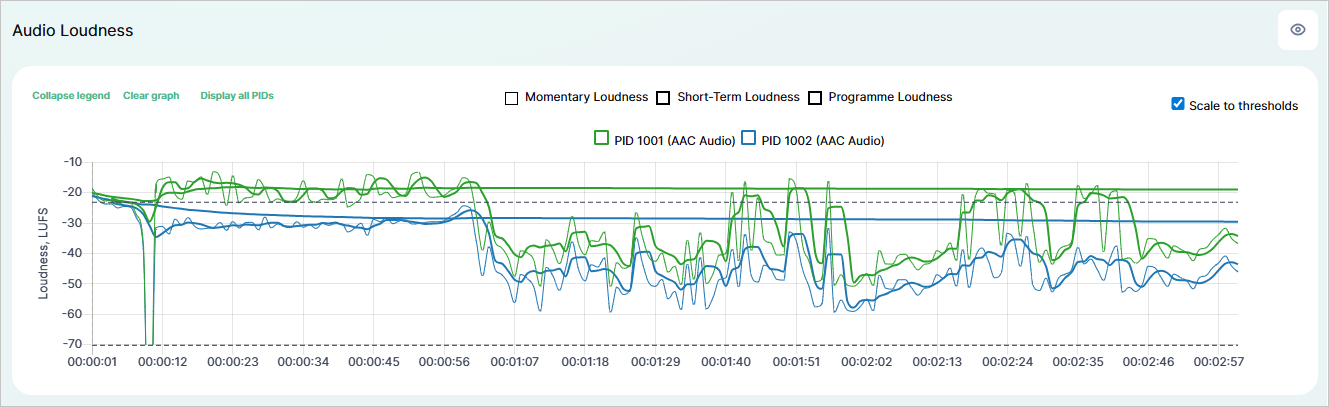
This block displays loudness levels in accordance with EBU R 128:
Momentary Loudness — loudness value measured using a sliding window with an integration time of 400 ms. The unit of measurement is LUFS.
Short-Term Loudness — loudness value measured using a sliding window with an integration time of 3000 ms without relative gating. The unit of measurement is LUFS.
Programme Loudness — the average (integrated) loudness over the entire duration of the program. The unit of measurement is LUFS.
The loudness graphs include a legend that lets you manage the displayed data.
Note
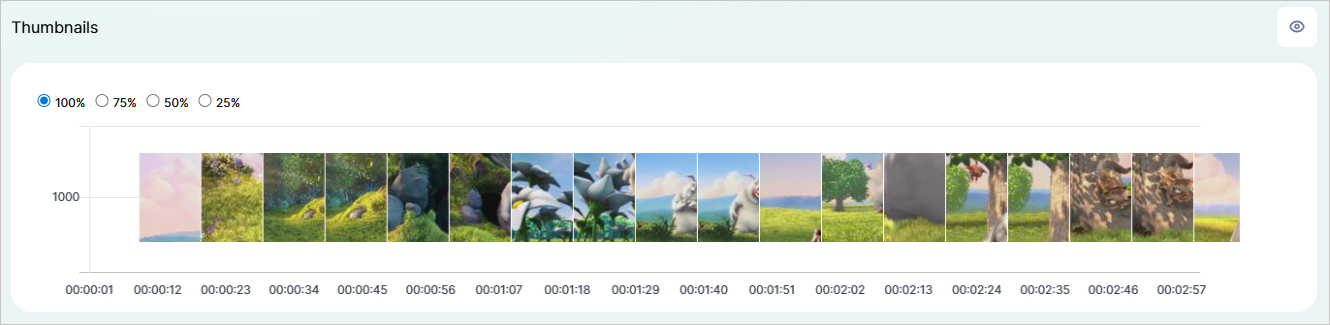
3.4.4. Thumbnails
3.4.5. Journal
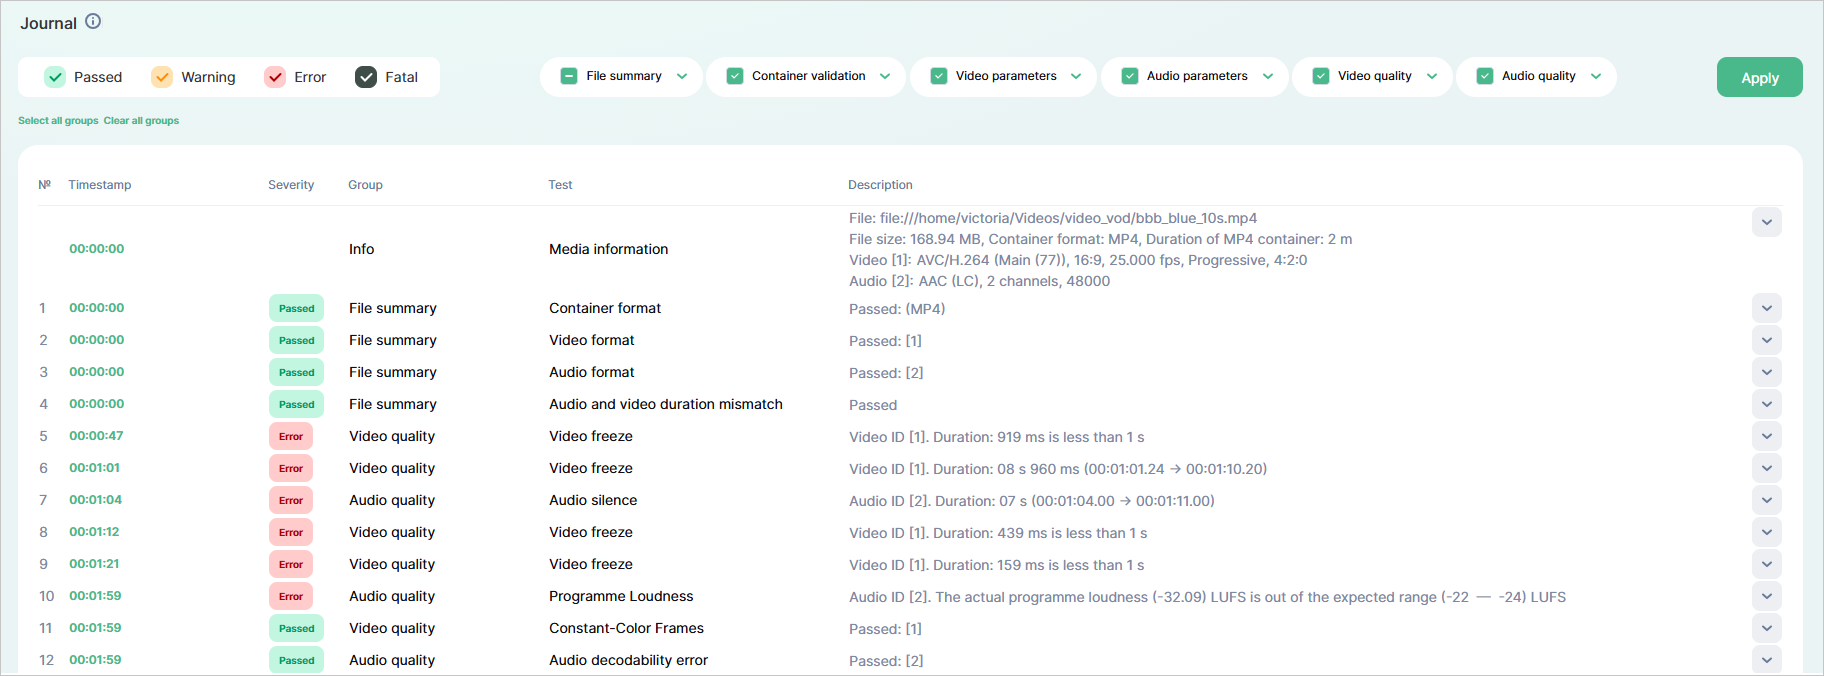
Each media file is validated by a probe against a predefined test template. A template includes a list of tests and compliance conditions. The Journal block contains a table with the results for each finished test. The following results are possible:
Passed— the test is considered as complete, the validated parameter meets the template conditions, and no errors were detected;Warning— the result forWarning-level tests, the validated parameter does not meet the conditions or errors were detected;Error— the result forError-level tests, the validated parameter does not meet the conditions or errors were detected;Fatal— the result forFatal-level tests, the validated parameter does not meet the conditions or critical errors were detected.
Passed result have a single entry for a video or audio track in the journal table.Warning, Error, and Fatal), the number of entries in the journal table will equal the number of detected errors.Passed, Warning, Error and/or Fatal—as well as by specific tests.
Tests are grouped into corresponding categories (File summary, Container validation, Video parameters, Video quality, Audio parameters, Audio quality).
The order and grouping are identical to those present on the Templates page. .
.Table columns:
№ — sequential number of messages in the journal;
Timestamp — time value (in hh:mm:ss format) of the media file when the system detected an error, or made a decision regarding the test result. Clicking on the timestamp will reposition the bitrate, audio track loudness, and video track thumbnails graphs to the selected time value;
Severity — indicator of the consequences that a test failure may lead to. You can specify the severity levels when configuring a template — these will spread on all tests. If the validated parameter meets the template conditions and no errors were detected, the Severity column will display the
Passedstatus; otherwise, it will display the corresponding severity level from the template (Warning,Error,Fatal);Group — all tests are grouped into corresponding categories (File summary, Container validation, Video parameters, Video quality, Audio parameters, Audio quality);
Test — name of the specific test scenario;
Description — contains a message with the actual and expected values. When validating media files with multiple tracks, if errors are detected, each track will have a separate journal entry, with the number of the problematic track specified.